PhD Candidate, Geography, McGill University
Daniel Romm receives funding from the Social Sciences and Humanities Research Council of Canada (SSHRC).
McGill University provides funding as a member of The Conversation CA.
McGill University provides funding as a member of The Conversation CA-FR.
View all partners
https://doi.org/10.64628/AAM.4v5cpn9jn
Share article
Print article
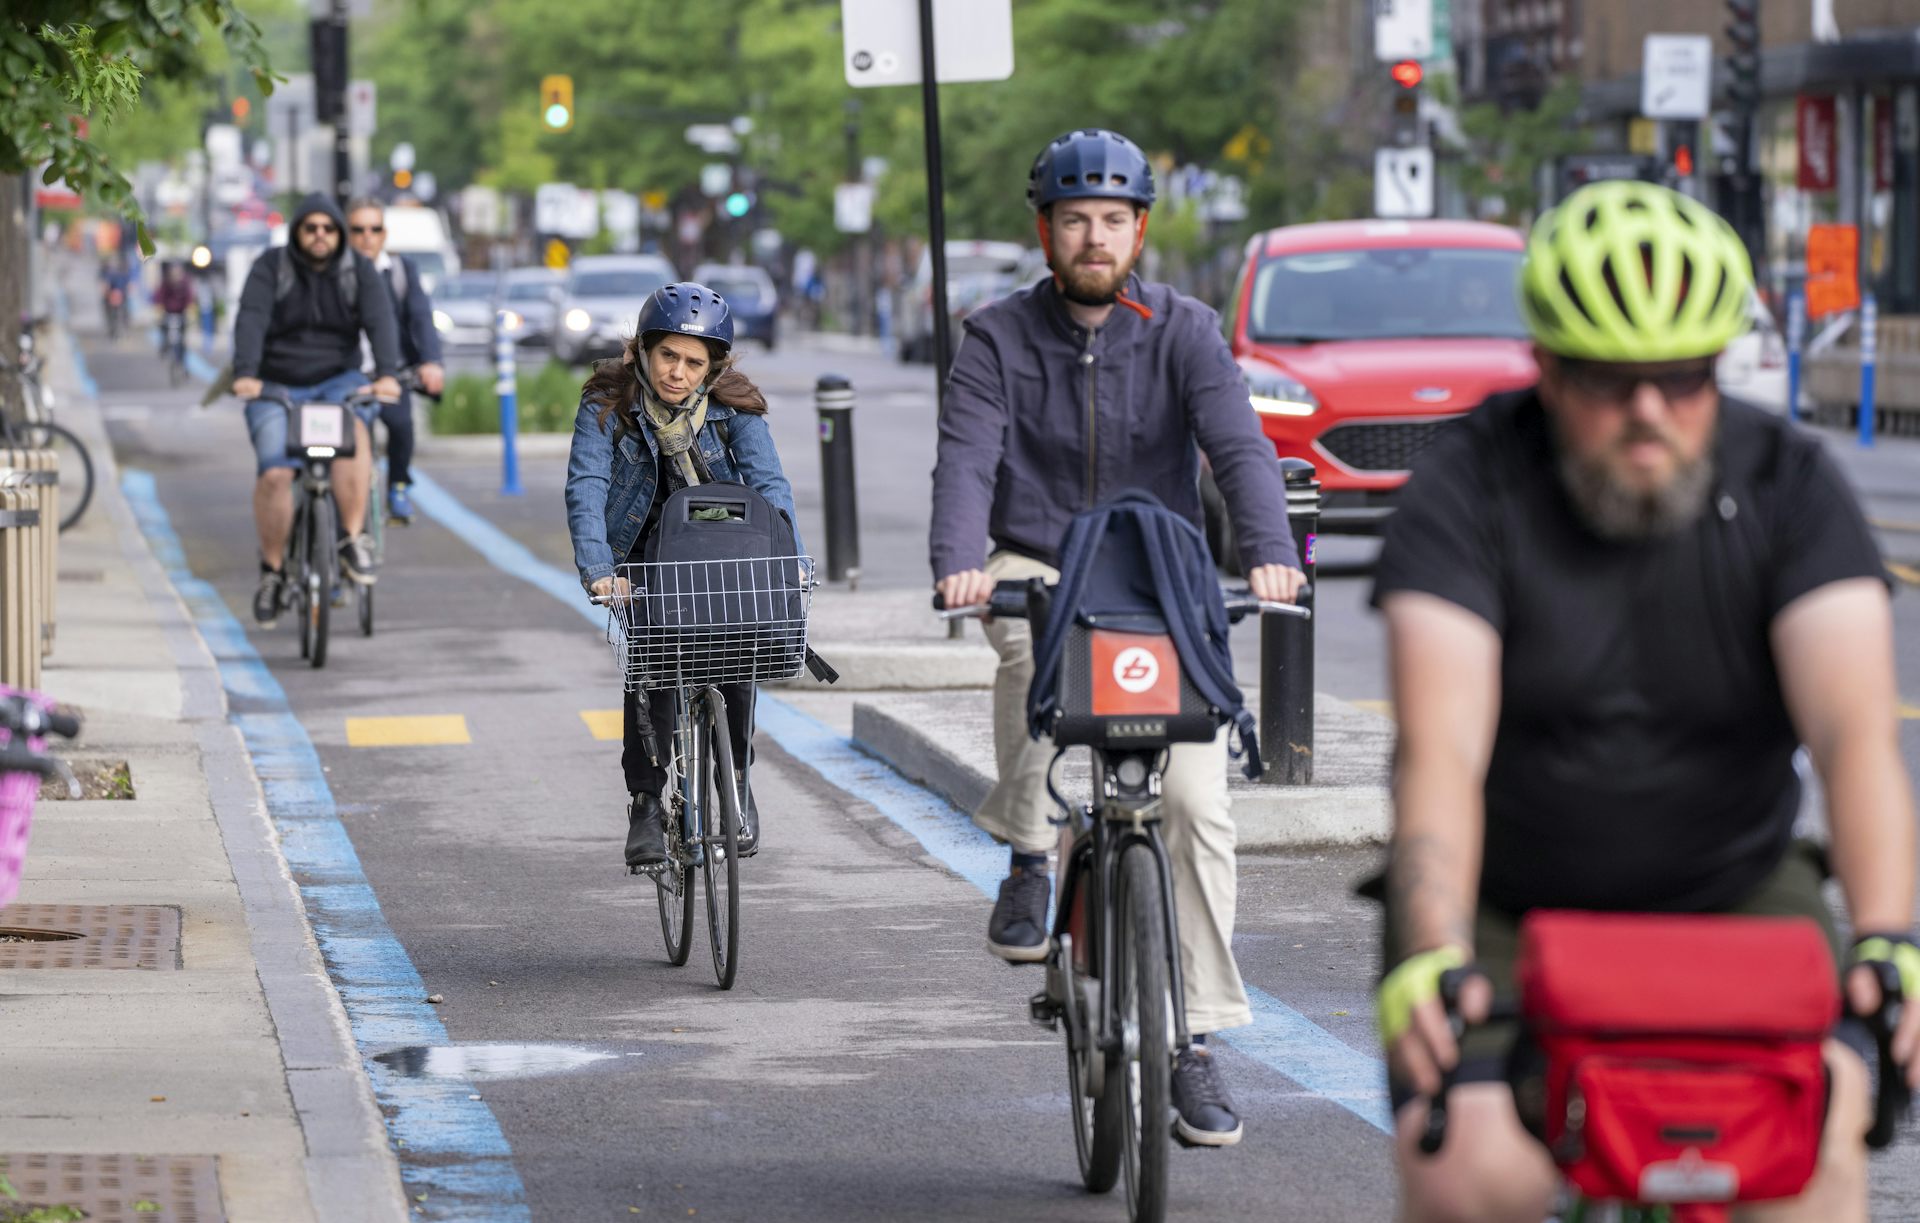
Montréal is often hailed as the most “biking-friendly” city in North America. But our research has found that only 2.3 per cent of the city’s roadways are allocated to bike infrastructure, with car infrastructure occupying the remaining 97.7 per cent of road space.
We measured the street space allocated to transport infrastructures across Montréal, and contrasted it with traveller counts by travel mode. We found a wide discrepancy: comparing bike travellers with car travellers, bikes represent 4.9 per cent of trips to 95.1 per cent for cars.
Proposals for new or expanded bike lanes are often met with fierce backlash, in a phenomenon dubbed “bikelash,” with car drivers reluctant to lose any street space.
Yet our study finds that the current imbalance of spatial allocation is so overwhelmingly in favour of cars that it’s possible to make substantial improvements to bike infrastructure without significantly decreasing the space allocated per driver.
After all, a key advantage of bicycles is their incredible space-efficiency. Even if all the bike infrastructure space in the city were to double, the proportion of roadway given to cars would not fall below 90 per cent in any borough.
Our research, with a focus on improving communication about street space use, presents several measures of spatial allocation. The first, and simplest measure, is the space allocated to a specific transport infrastructure.
We found that 97.7 per cent of road space was dedicated to cars, and 2.3 per cent to bicycles. When we included sidewalks, 79.6 per cent of space was taken up by cars, 18.8 per cent to sidewalks and just 1.6 per cent for bikes.
Boroughs typically associated with cycling tended to have the greatest proportion of space given to bike infrastructure. In Montréal, Le Plateau-Mont-Royal, a neighbourhood viewed as trendy and bike-friendly, leads with 4.7 per cent.
The second measure we used in our research is space per traveller per mode of travel.
In Le Plateau Mont-Royal, where 21.9 per cent of trips started in that borough are by bicycle, we find that drivers are given 3.4 square metres per traveller, while bike travellers are allocated 1.5 square metres per traveller. This measure can be used to understand the relationship between infrastructure space and traveller counts.
We can also present this as the difference between the space allocated to bike infrastructure and the percentage of cyclists, which shows the discrepancy between space and travel across the city.
We developed the Equal Infrastructure Allocation (EIA) score to understand how the space per traveller for one mode compares to that for another. We used the EIA to compare the bike space per traveller to the space per traveller for those in cars: when the EIA is zero, car and bike travellers are allocated the same amount of space per traveller. When the EIA falls below zero, space is biased in favour of the automobile.
Using the EIA, we found that nine of Montréal’s 19 boroughs present spatial inequality in favour of cars; Le Plateau had the worst score at -0.55.
These measures can also be modelled for prospective changes to infrastructure, such as installing a new series of bike lanes, to better communicate about how such projects would affect the space.
In April 2024, Montréal’s BIXI bikeshare system had more than 11,000 bikes at over 900 stations. That’s a lot of bikes, but because they’re so space-efficient, the total space used by BIXI in Montréal is just 0.021 square kilometres. If BIXI were to double the number of bikes and stations, the amount of car space per traveller would decrease by 0.003 square metres.
We modelled what would happen if we were to double all the bike infrastructure in Montréal. We found that space would increase for bikes by 4.4 square metres per traveller; meanwhile, the space for someone travelling by car would decrease by 0.2 square metres.
In Le Plateau, drivers would lose just 0.15 square metres per traveller, and across the city, all but two boroughs would have positive EIA scores.
The current imbalance of space per traveller is so far in favour of cars that bike infrastructure projects improve the spatial picture for cyclists to a far greater extent than they worsen spatial allocation for drivers.
There are many well-established reasons for improving bike infrastructure and encouraging sustainable travel modes, including reducing reducing car fatalities.
Our findings corroborate this, finding a strong correlation between more bike infrastructure with decreased collision rates of cars with bikes.
Bike infrastructure projects often face intense, entrenched opposition. Our research provides tools for planners, policymakers, advocates and researchers to evaluate the current spatial picture, and to illustrate what the effects of alternative infrastructure would look like.
In our study of Montréal’s streets, we found that even with bike infrastructure improvements at a scale dramatically larger than anything proposed today, street space still remains biased in favour of cars.
Copyright © 2010–2025, The Conversation Media Group Ltd

