
Market Spotlight
September 25, 2025 |
Download
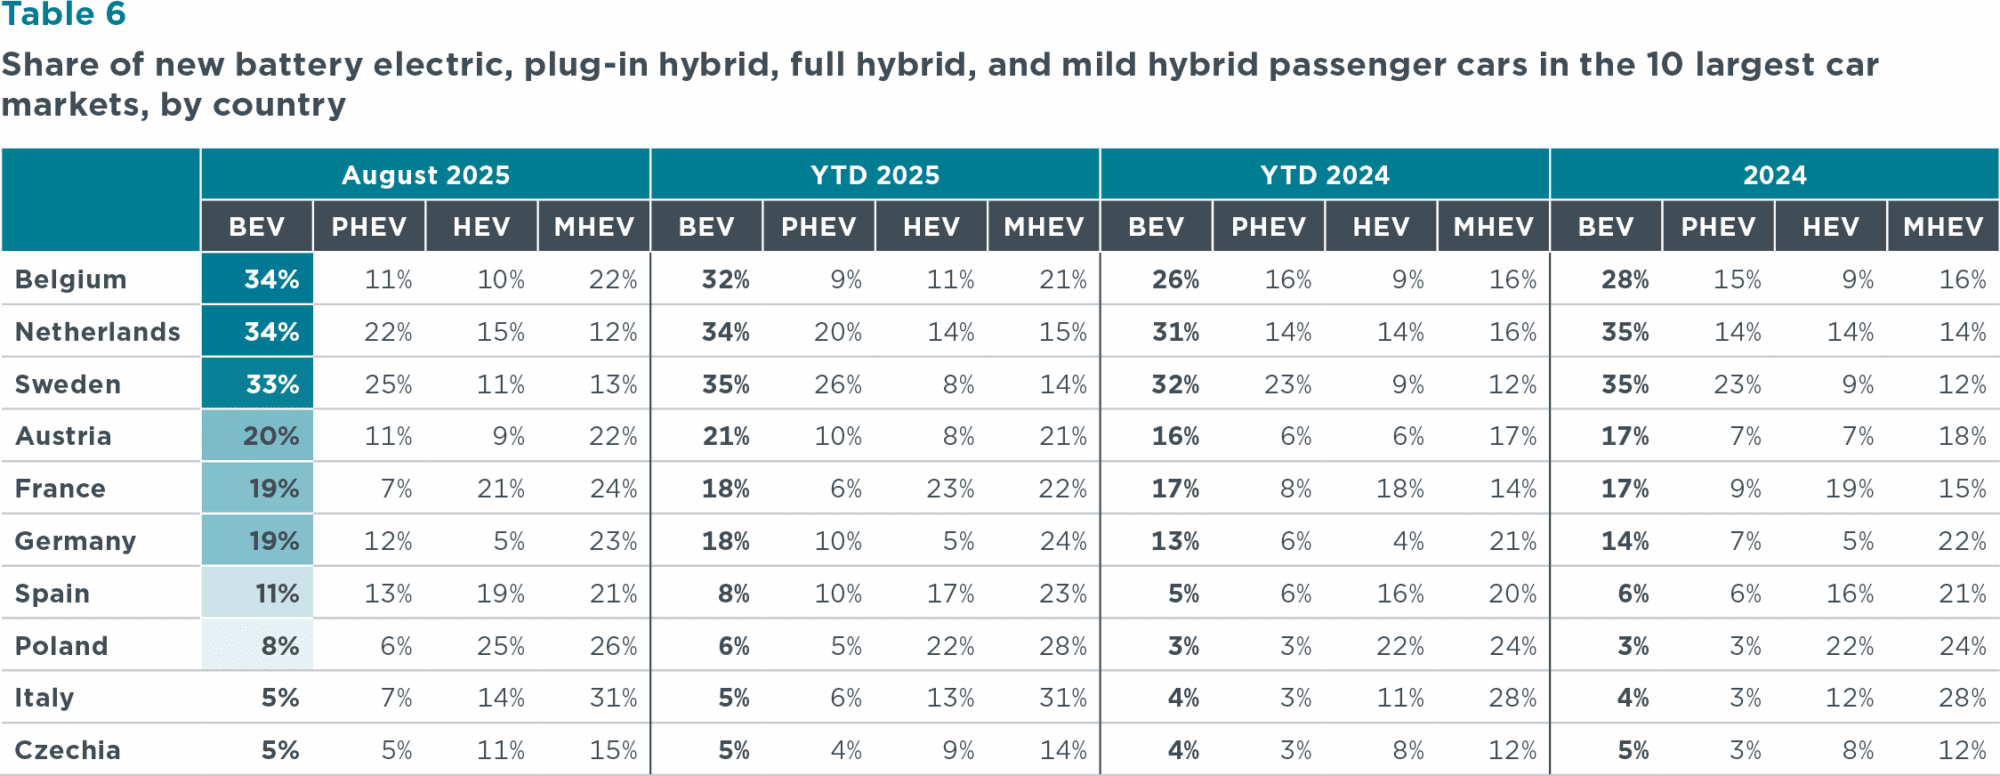
The average share of battery electric vehicles (BEVs) among total new registrations in Europe reached 19% in August 2025, up from 17% in July. The BMW pool led with a 29% share and was followed by the Mercedes-Volvo-Polestar (26%), Hyundai (22%), Kia (21%) and Volkswagen (20%) pools. The Tesla pool (16%), SAIC (13%), the Renault pool (12%) and Nissan (8%) all were below the European average. Year-to-date (YTD) 2025, the BEV share remained stable at 17%, which represents an increase of 4 percentage points compared with the same period of 2024. Several manufacturing pools had significant increases in BEV shares in YTD 2025 versus YTD 2024. Kia (20%) and Volkswagen (18%) both recorded increases of 8 percentage points, while BEV shares for the Hyundai (18%) and BMW (25%) pools increased 7 and 4 percentage points, respectively. In contrast, SAIC stood out with a drop from 38% in YTD 2024 to 13% in YTD 2025. Plug-in hybrid electric vehicles (PHEVs) had an average market share among new registrations in Europe of 9% in YTD 2025 (up 2 percentage points over YTD 2024), led by the Mercedes-Volvo-Polestar pool (23% share). For full hybrid electric vehicles (HEVs), SAIC (41%), Nissan (37%), and the Renault pool (29%) recorded the largest shares in YTD 2025. In the mild hybrid electric vehicle (MHEV) segment, the BMW and Mercedes-Volvo-Polestar pools led registration shares, each with a 37% in YTD 2025.
Figure 1. Share of battery electric in new passenger car registrations in Europe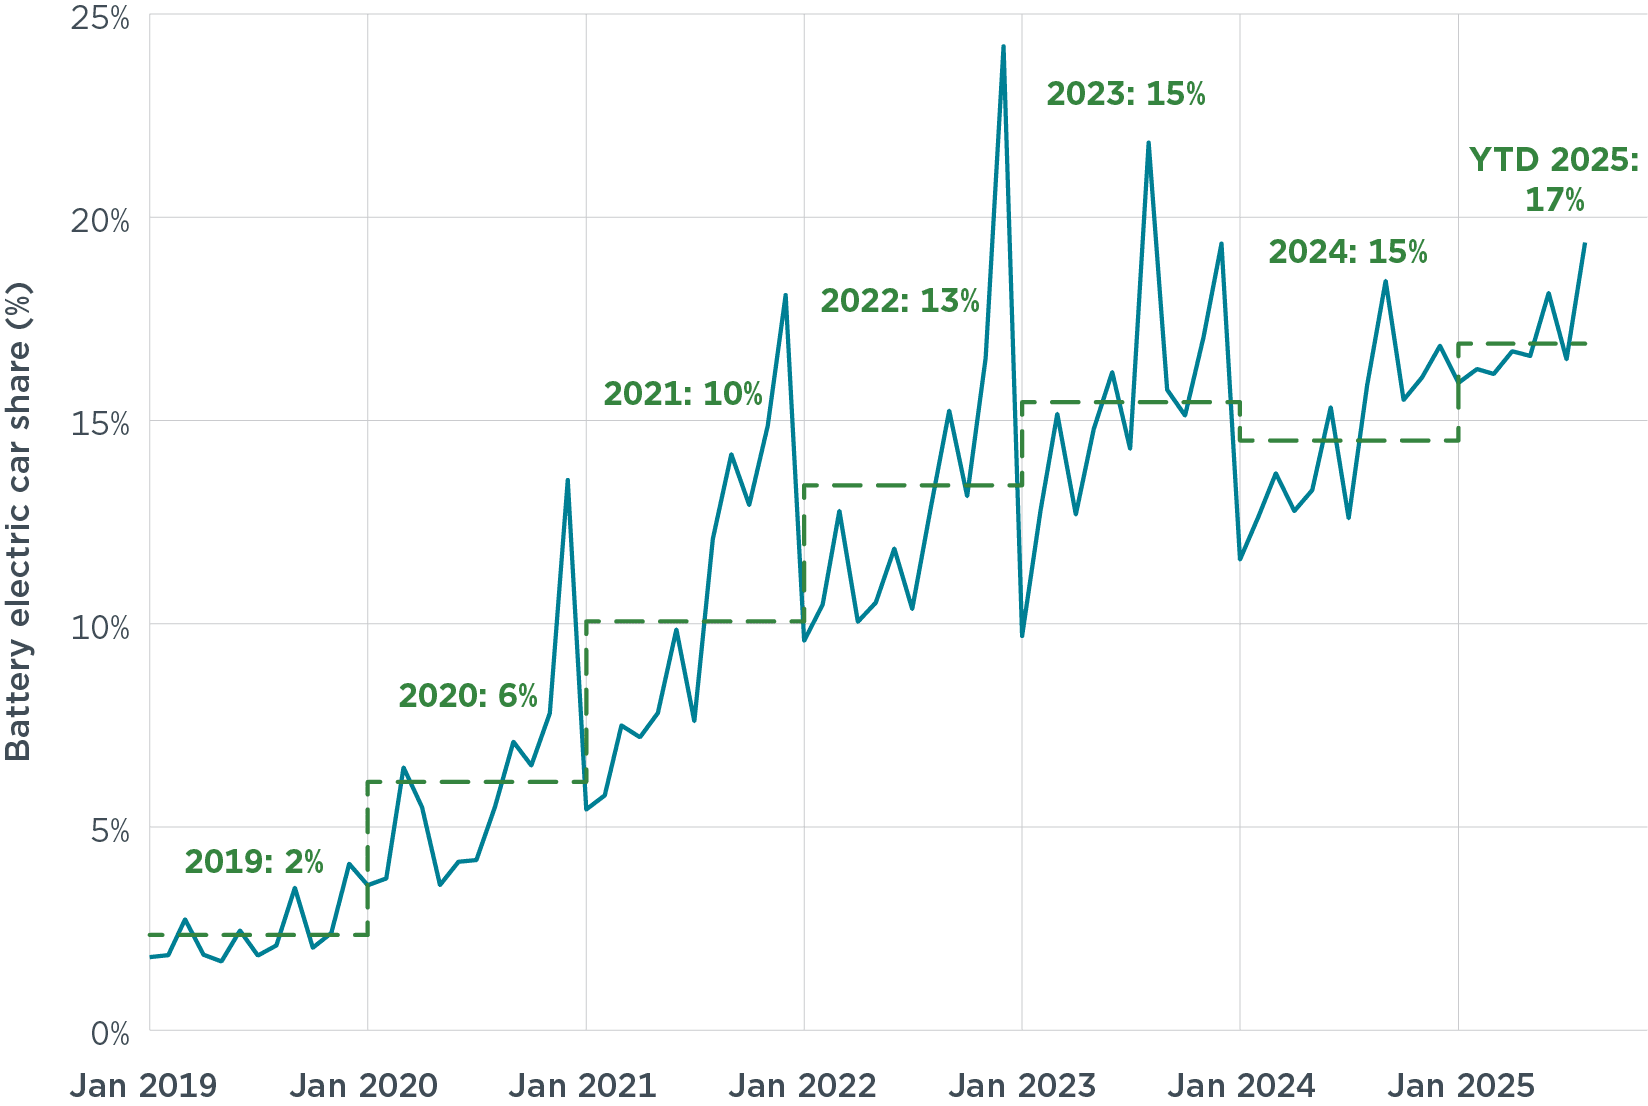
Figure 2. Average CO2 emissions of manufacturer pools and individual manufacturers compared with estimated 2025-2027 targets, 2025 YTD
Note: Includes compliance credits. All CO2 values are estimates according to the Worldwide harmonized Light vehicles Test Procedure (WLTP). Only manufacturer pools and individual manufacturers with at least 1% market share YTD are shown. See the section on definitions, data sources, methodology, and assumptions for more.
Looking at individual car brands with market shares of 1% or greater, apart from Tesla, Volvo had the greatest over-compliance at 28 g CO2/km below its projected brand-level average target for 2025–2027, followed by Cupra (15 g CO2/km below its target) and Mini (13 g CO2/km below its target). Nissan, Mazda, and SEAT currently have the largest target gaps at 30, 26 and 25 g CO2/km, respectively.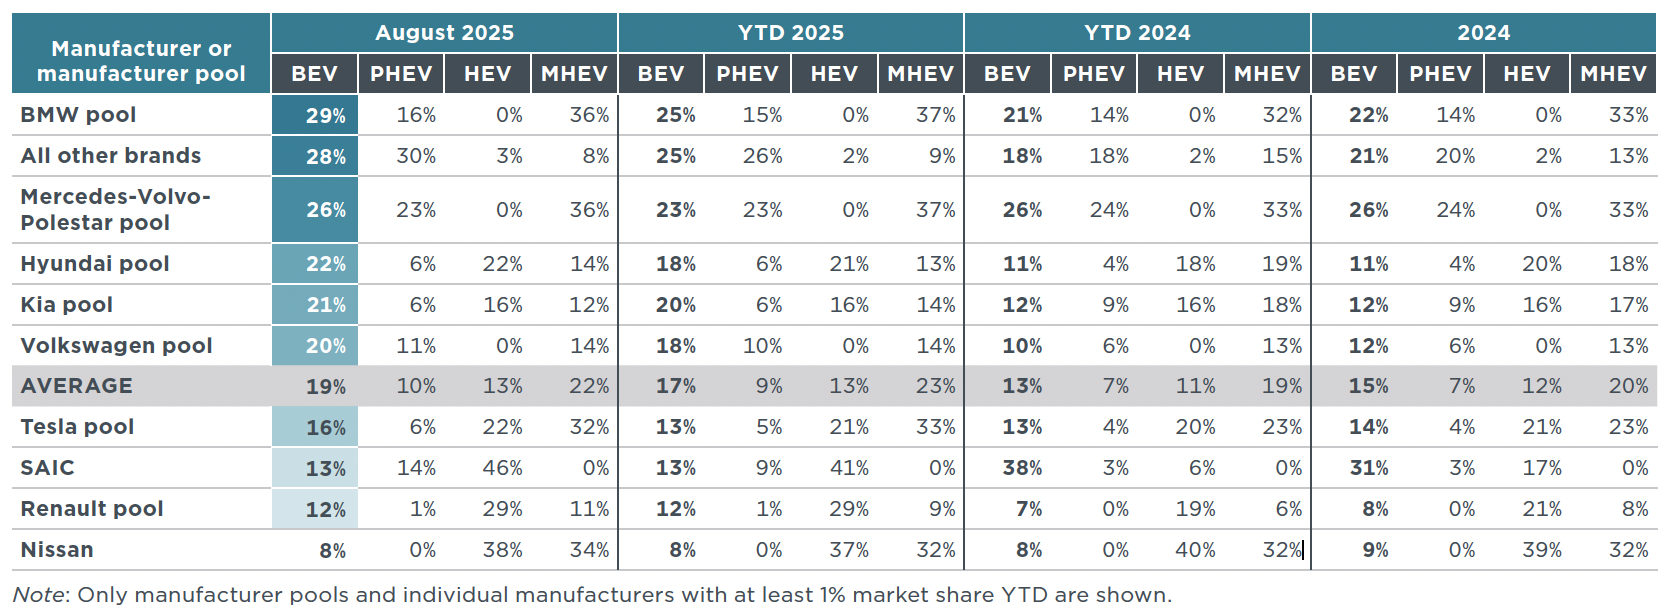
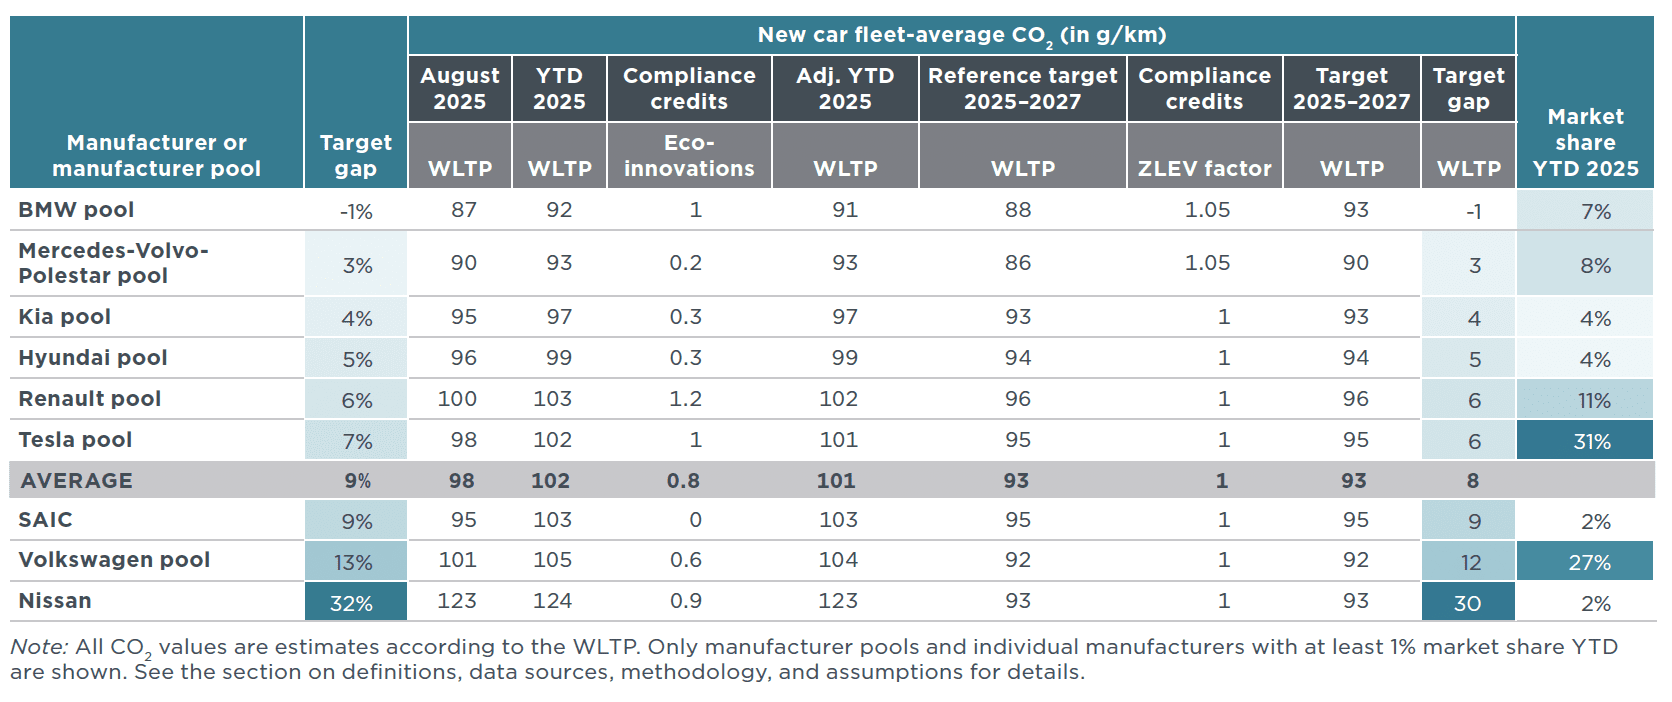
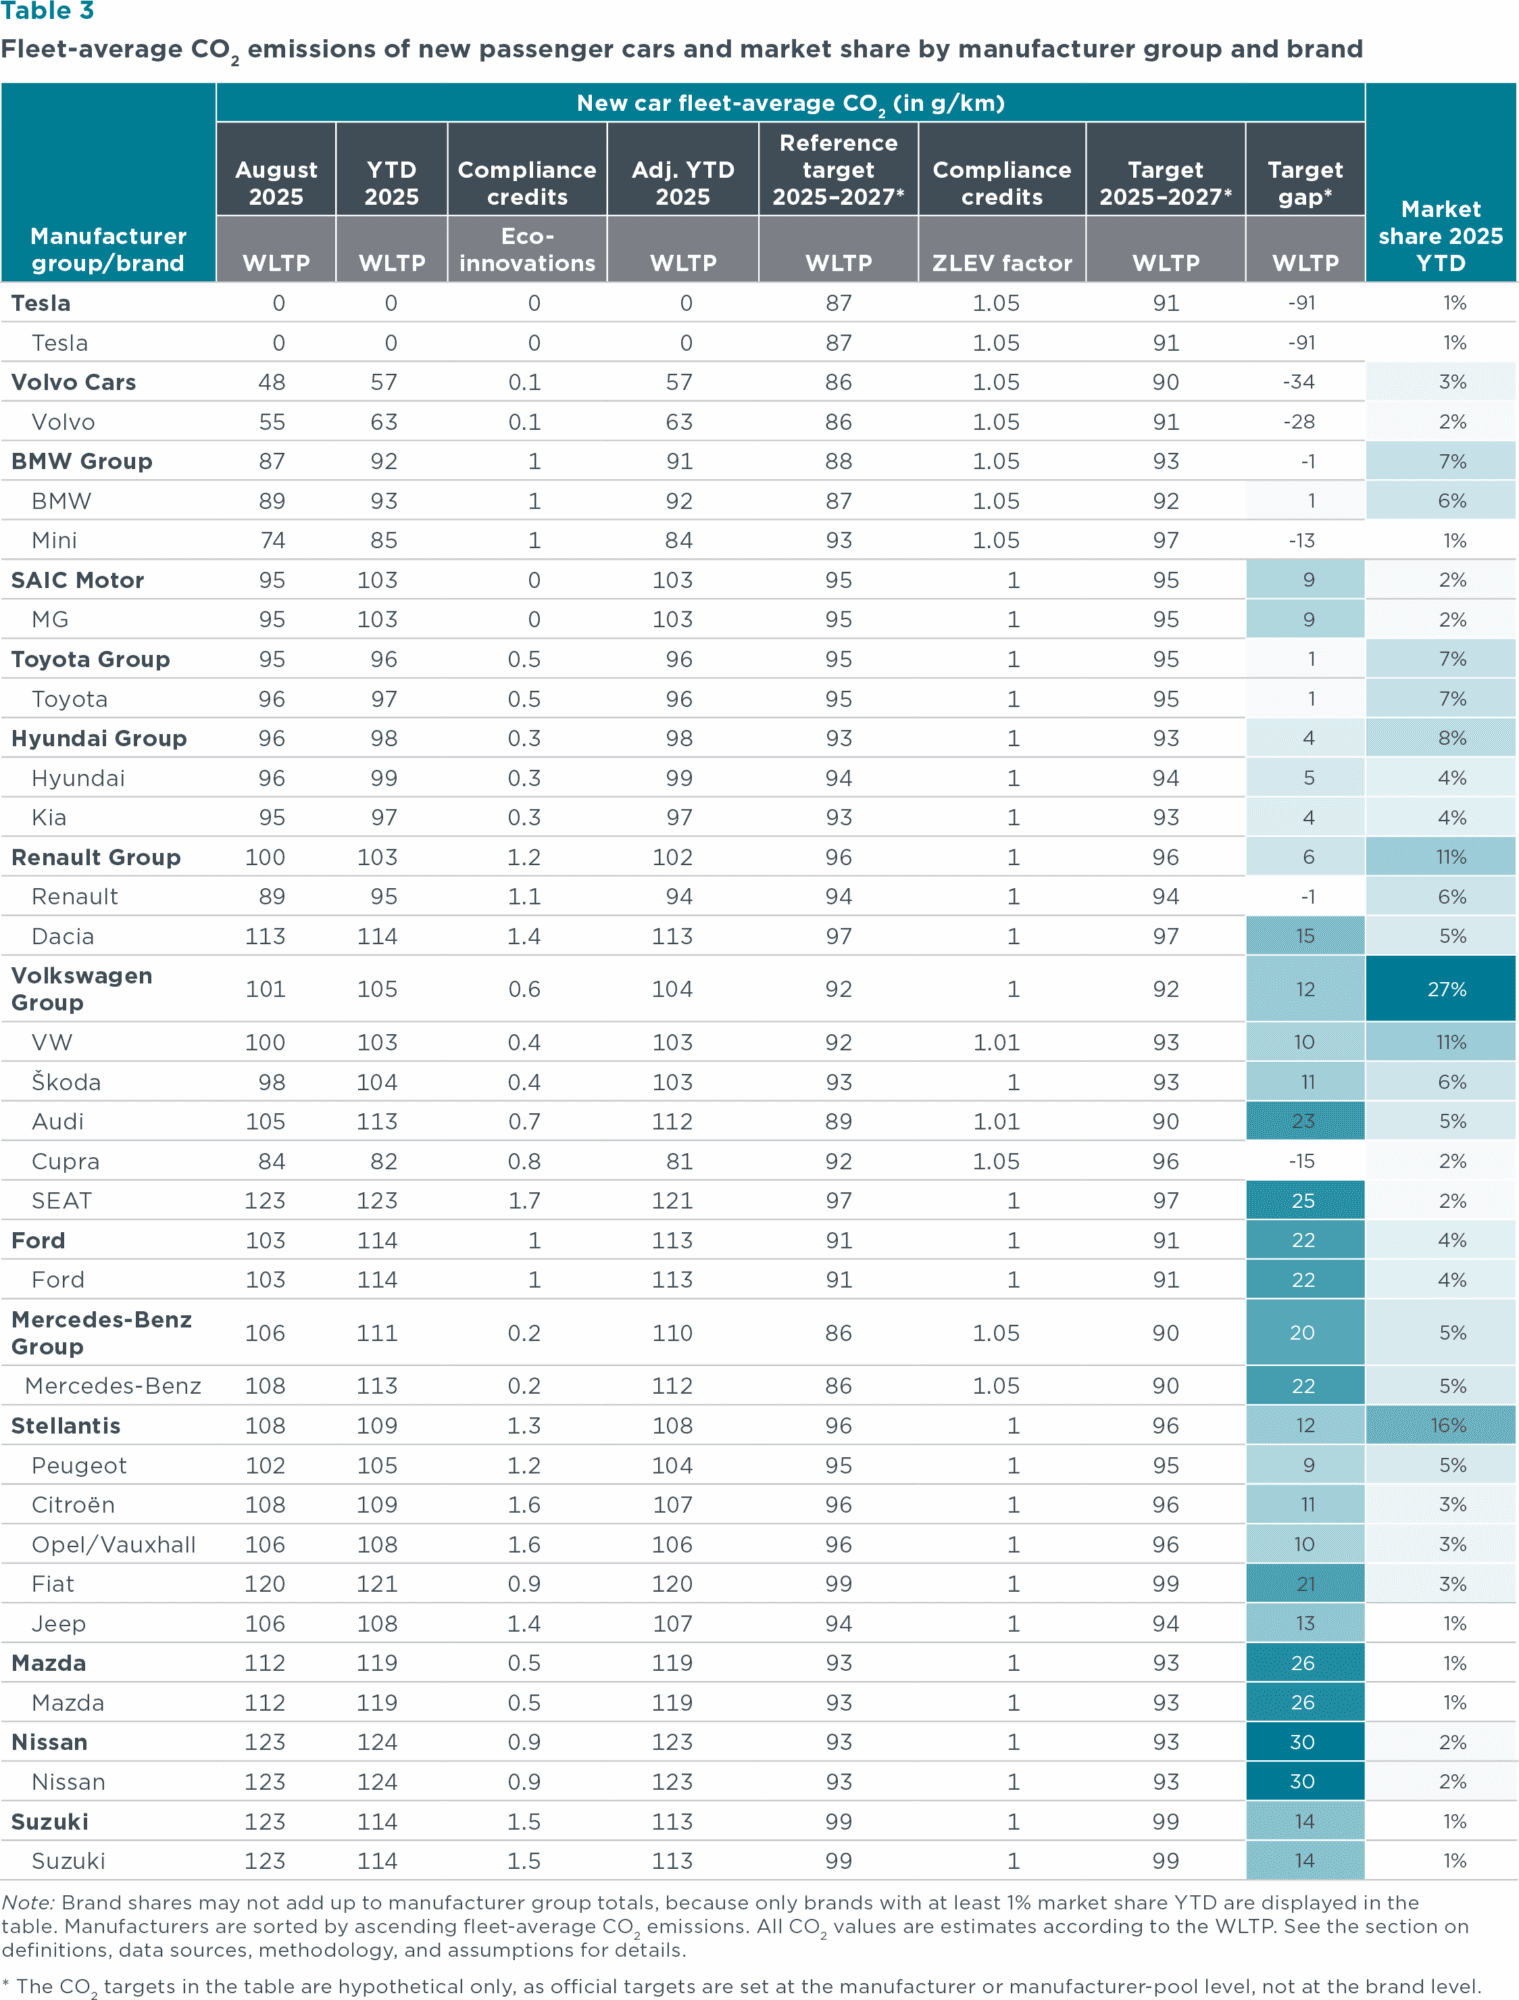
Figure 3. Share of plug-in hybrid and battery electric passenger cars by country, including information on market size (total new car registrations)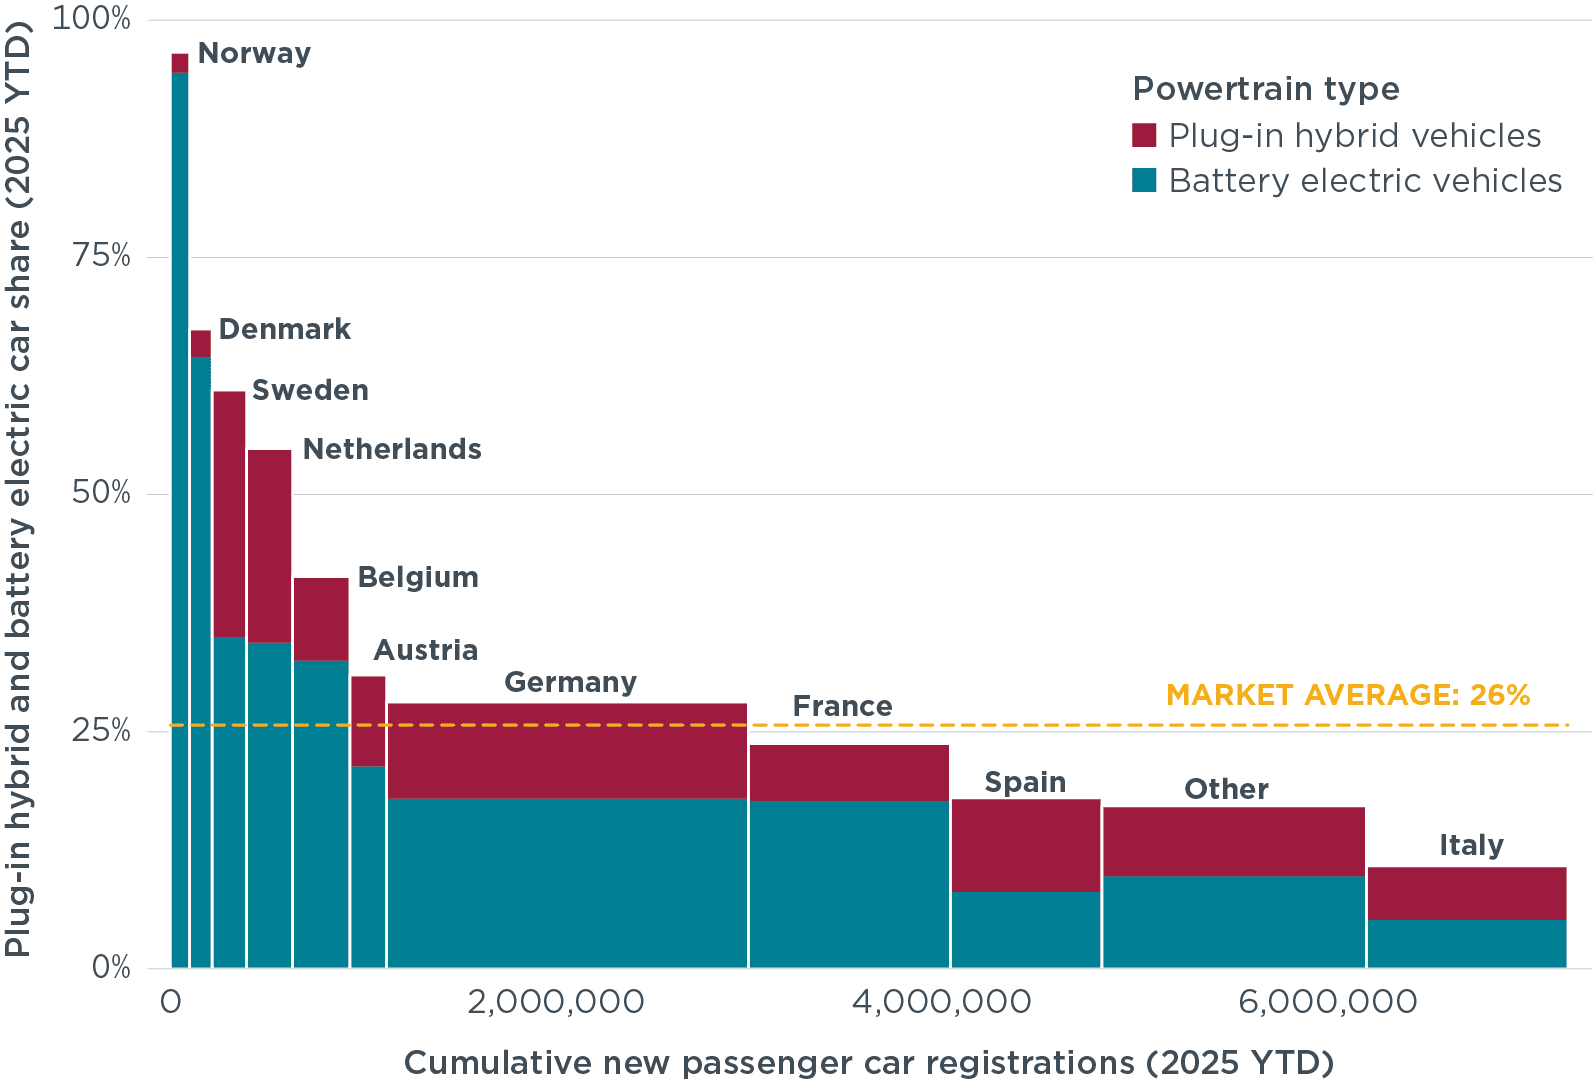

Corporate fleets, comprised of company fleets (35%), car dealers and manufacturers (15%), and short-term rentals (8%), made up 59% of total registrations in July 2025, while private cars made up 41% of the market. Short-term rental registrations fluctuate more than other owner types; they ranged from only 6% in Q3 2024 to nearly 13% of sales in Q2 2025. In July 2025, the split of new registrations by owner type largely mirrored that of Q3 2024.
Figure 4. New passenger car registrations by owner for 19 select European countries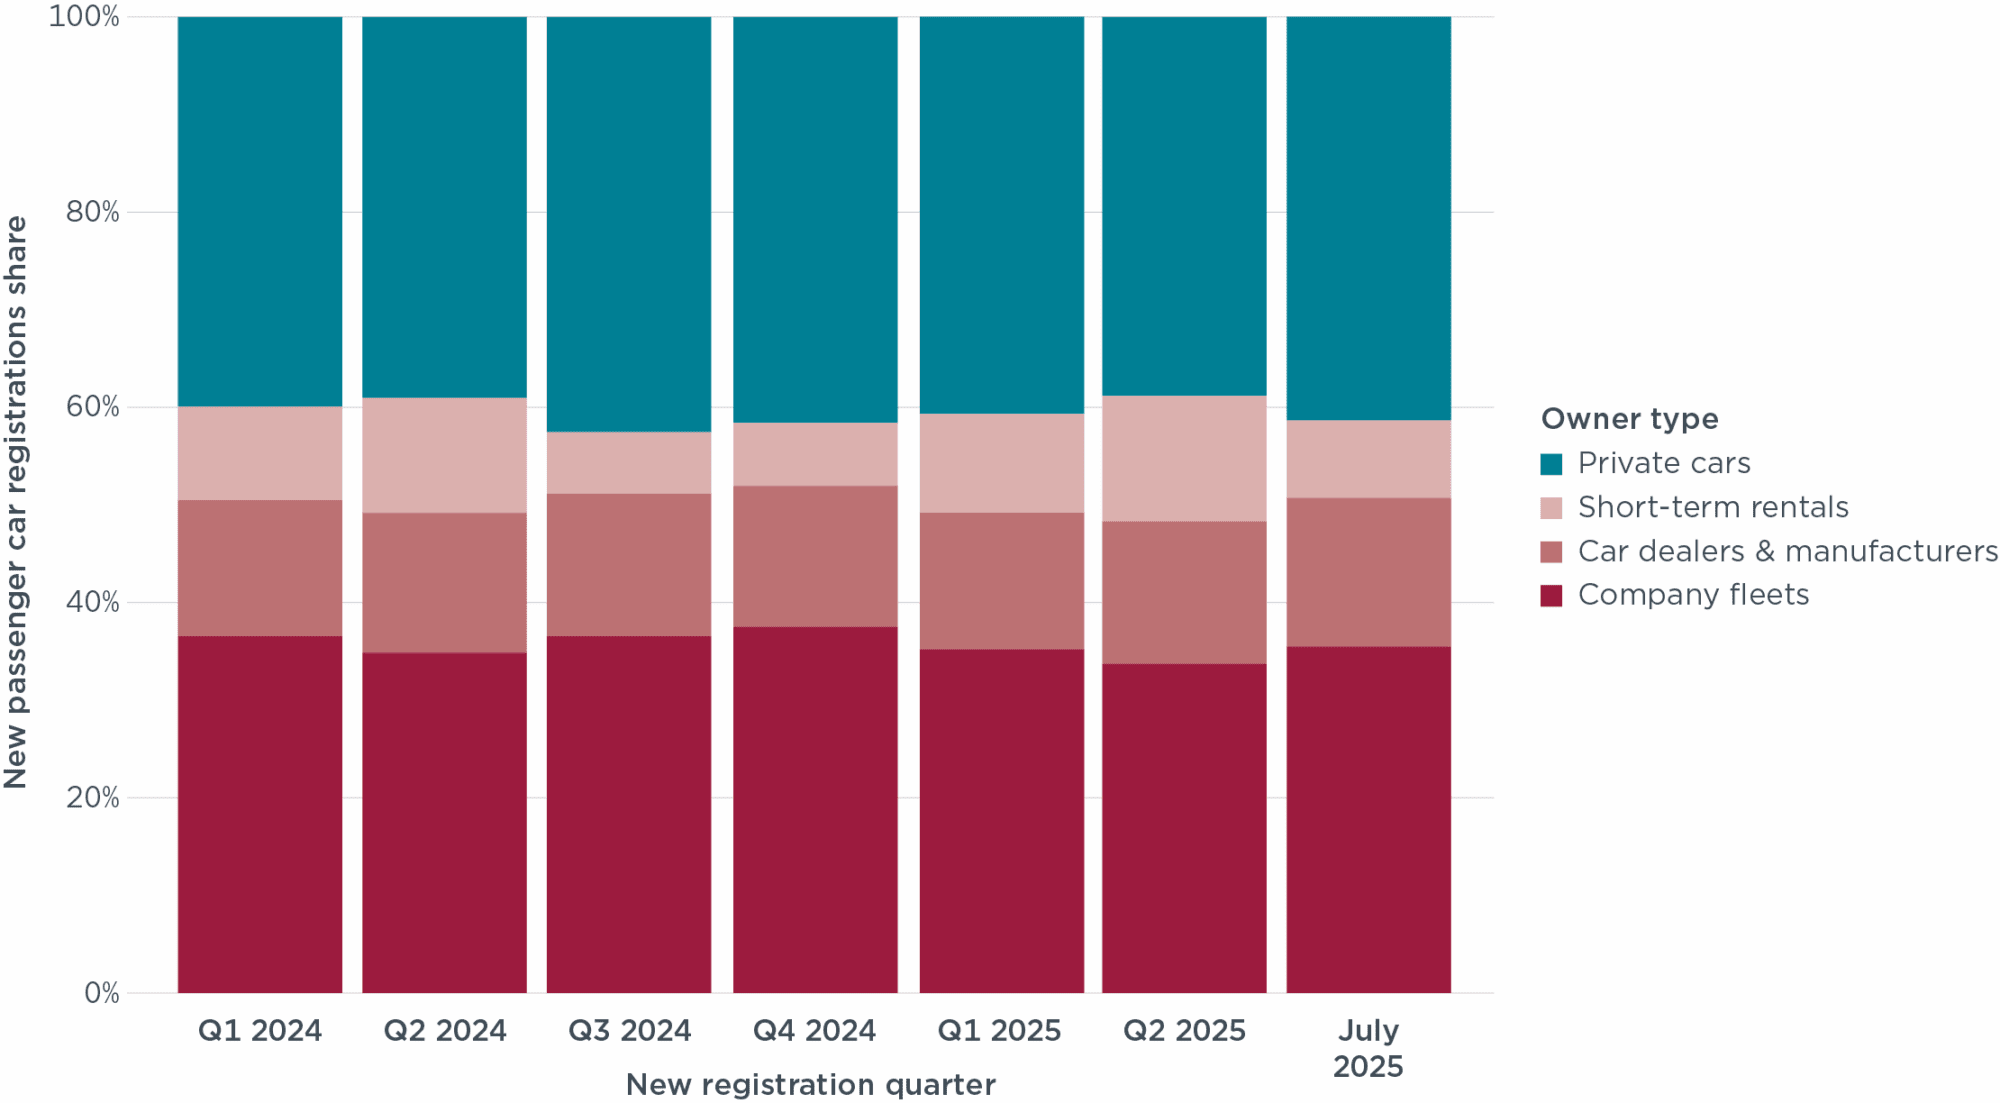
After leaving the EU in January 2020, the United Kingdom developed its own CO2 targets for new light duty vehicles and implemented a zero-emission vehicle (ZEV) mandate. Since 2024, car and van manufacturers have been required to meet annual ZEV registration percentage targets, replacing the EU’s stepwise CO2 targets set at five-year intervals. Unlike in the EU, the U.K. regulation prohibits manufacturers from forming pools with carmakers outside their ownership group. However, within a group, manufacturers that exceed their ZEV targets can share spare allowances with affiliates that fall short. Manufacturer groups can also trade allowances to other groups.
Since their introduction, these measures have created stronger incentives to accelerate electric vehicle sales in the United Kingdom compared with the EU. Battery electric cars increased their market share from about 17% in 2023 to roughly 20% in 2024, and approximately 22% YTD, around five percentage points higher than the combined YTD average share for the EU, Norway, and Iceland. Over the past five years, BEV registrations in the United Kingdom have tended to surge in the run-up to the end of the annual compliance period on December 31. Thus, the 2025 year-end market share is likely to be closer to the 2025 target set at 28%.
Although manufacturers missed the 2024 U.K. ZEV target of 22% on average, they effectively over–complied by using non-ZEV CO2 credits. These credits can be earned by improving the CO2 emissions performance of non-zero-emission cars relative to manufacturer-specific CO2 baseline values. This flexibility effectively lowered the 2024 fleet-wide ZEV target from 22% to 18%. For 2025, the estimated effective target—accounting for these flexibilities—is about 22% and, therefore, manufacturers are expected to again be in compliance. In April 2025, the U.K. Government proposed additional flexibilities to the ZEV regulation, such as higher caps for non-ZEV CO2 credits, that are expected to further lower the effective ZEV share targets.
Complementing the supply-side ZEV mandate, the United Kingdom offers consumer-facing incentives, including reduced taxes for the private use of zero- and low-emission company cars. In addition, upfront purchase incentives of up to £3,750 (about €4,300) for qualifying ZEV models were reintroduced in August 2025. As of August 2025, only two models are eligible for the maximum grant.
The rapid rise in BEV adoption in the United Kingdom has taken place despite the high cost of public charging, which is typically at least seven times higher than home charging, thus costing a similar amount to fueling an equivalent gasoline vehicle. With lower public charging costs, the uptake of BEVs would likely have been even stronger.
Figure 5. Share of battery electric in new passenger car registrations in the United Kingdom and EEA countries
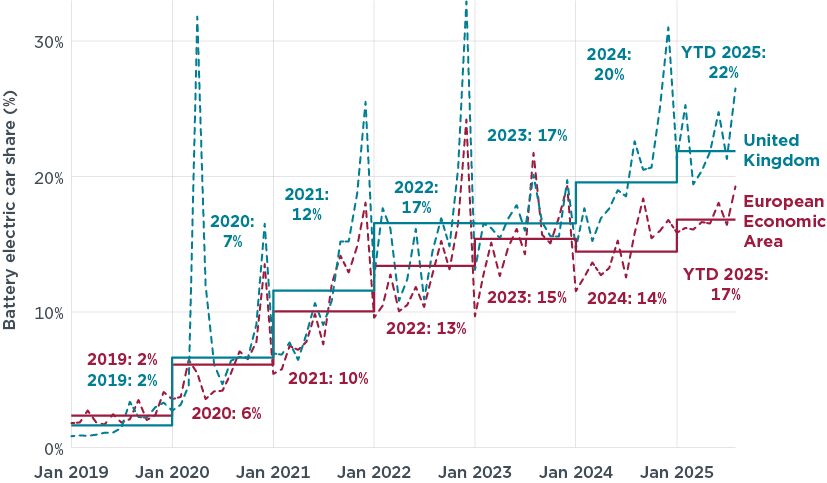
Figure 6. Battery electric car share by manufacturer group compared with their estimated 2025 targets in the United Kingdom, YTD 2025. Source: New AutoMotive.
This publication is a collaboration between the ICCT, IMT-IDDRI, and ECCO think tank.
Download
European Market Monitor: Cars and vans (June 2025)
July 25, 2025
European Market Monitor: Cars and vans (May 2025)
June 25, 2025
European Market Monitor: Cars and vans (March 2025)
April 30, 2025
The EV Transition Check: Measuring progress towards zero-emission for passenger cars in the European Union
September 10, 2025
Join our mailing list to keep up with ICCT’s latest research and analysis.
Contact Us
We use cookies to improve site functionality and make this website more useful to visitors. Find out more.
This website uses cookies to enable some basic functionality and also to help us understand how visitors use the site, so that we can improve it.
Essential cookies provide basic core functionality, such as saving user preferences. You can disable these cookies in your browser settings.
We use Google Analytics to collect anonymous information about how visitors interact with this website and the information we provide here, so that we can improve both over the long run. For more on how we use this information please see our privacy policy.
Related Article